ACT Science Practice Test 1 (40 questions) with Answers and Explanation. You can download Full ACT Science Practice Test PDF in a printable and editable file for free. Prepare your ACT Science final exam test.
Table of Contents
| Test Name | ACT Test Prep |
|---|---|
| Category | Free ACT Practice Test |
| Knowledge tested | ACT Science Test |
| Type of Question | Sample Multiple Choice |
| Topics | Data representation, Research summary, Conflicting viewpoints |
| Total Question (MCQ) | 40 |
| Total time duration | 35 minutes |
| Answers Available | YES |
| Recommended Devices | Use a laptop or desktop |
| Printable PDF | Available |
The passages in this test are followed by several questions. After reading each passage, choose the best answer to each question. You may refer back to the passages as often as necessary. You are not permitted to use a calculator on this test.
The earth’s gravitational force produces a downward acceleration of 9.8 m/s 2 on all objects near the earth’s surface. Other forces, including those produced by wind and aerodynamic lift, as well as jet, rocket, internal combustion or other engines may also exert upward or downward forces on these objects. These other forces, acting in combination with gravity, can cause a net force greater than or less than gravity, and, therefore, a net acceleration different from the downward acceleration of 9.8 m/s 2 caused by gravity.
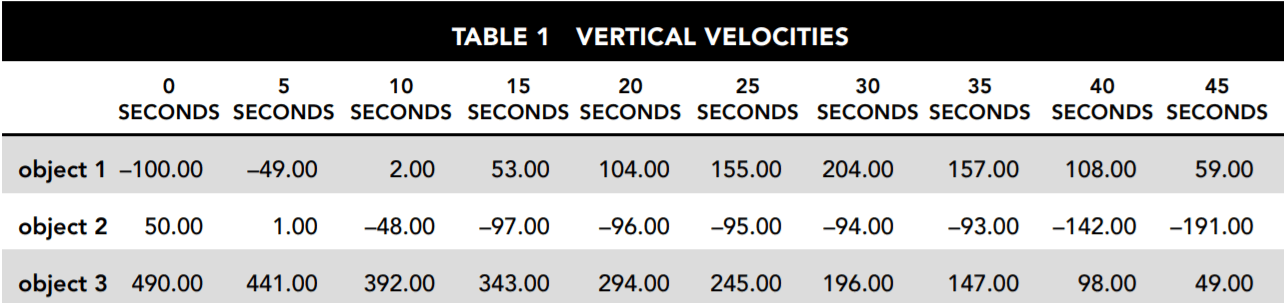
Table 1 and Figure 1 provide information about the vertical velocities measured for three different objects without regard to the horizontal motion of the objects. Each of the objects is operating under the influence of gravity for the entire 45 seconds being studied. They each may also be influenced by other vertical forces for all or part of that period. Where other forces have been applied, they always begin and end at one of the 5-second intervals.
Table 1 indicates the vertical velocities of the three different objects as measured every 5 seconds. Positive velocities indicate motion upward, and negative velocities indicate motion downward.
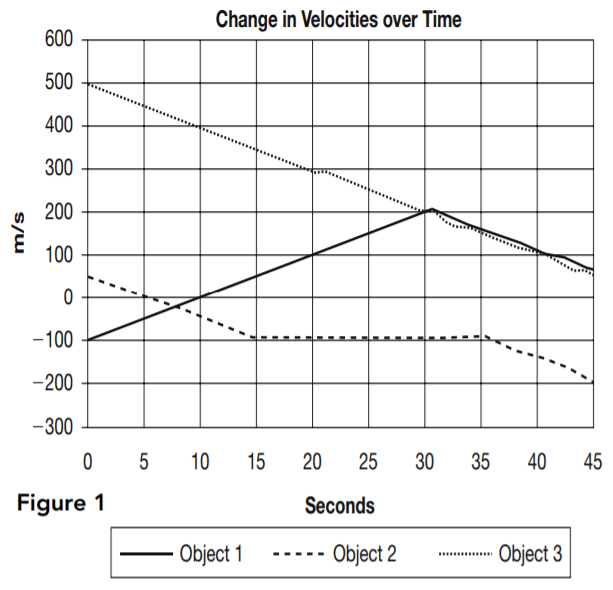
Figure 1 is a graphical representation of the velocity of each object at every point during the 45 seconds under review.
1. Which of the three objects may be traveling solely under the influence of gravity for the entire period shown?
Answer: D
The force of gravity produces an acceleration of –9.8 m/s 2 . This means that the velocity must change by –49 m/s every 5 seconds because 5 × –9.8 = –49. Object 3 begins with an upward velocity of 490 m/s but is reduced by exactly 49 m/s during every 5-second interval shown. None of the other objects consistently experiences a change in velocity of –49 m/s every 5 seconds. Object 1 has a positive change of 51 m/s in the first 5 seconds. Object 2 operates under the influence of gravity alone for 15 seconds but then between seconds 15 and 20 has a positive change in velocity of 1 m/s
2. For the time period shown, which of the three objects is/are traveling solely under the influence of gravity for at least part of the 45-second period?
Answer: B
For at least part of the period shown, objects 1, 2, and 3 experience a change in velocity of –49 m/s every 5 seconds, which is the magnitude of change gravity causes. For object 1, this occurs between seconds 35 and 45. For object 2 this occurs from second 0 to second 15 and also from second 35 to second 45. Object 3 experiences a reduction of 49 m/s in velocity every 5 seconds from second 0 to second 45.
3. For second 5 through second 25, which of the objects is/are moving with constant acceleration?
Answer: D
Constant acceleration means that the change in velocity for the period specified from second 5 to second 25 must always be the same. This is true for object 1 and object 3. Object 1 has an upward (positive) change in velocity of 51 m/s every 5 seconds for the period being looked at. Object 3 has been shown to be operating only under the influence of gravity, producing a change in velocity of –49 m/s every 5 seconds for the entire period, including the one asked about here. Object 2 has a constant change of –49 m/s only for second 5 to second 15. It then changes to +1 m/s for second 15 to 35, so the change is not constant for the entire period specified.
4. Which answer best describes the motion of object 1?
Answer: A
In Table 1, downward velocity is represented by negative numbers, and upward velocity is represented by positive numbers. Therefore,
everything below the zero line in Figure 1 represents downward motion, and everything above represents upward motion, regardless of which direction the line on the graph is headed. When the graph line crosses 0, this indicates that the direction of the object changes at that point.
A positive change in the direction of the line on the graph indicates a positive change in velocity. If the line is below zero, this means that the object moves downward but at decreasing speed. If the line is moving upward above zero, this means the object is moving upward at an increasing speed.
Only answer choices A and B state that the object is traveling downward at second 0. This is correct because the graph line begins at –100. Figure 1 indicates that the object reaches zero velocity at approximately 10 seconds. Changing from negative to positive velocity means it changes direction from downward to upward. Table 1 indicates that that point is a bit before second 10 since it is already traveling upward at 2 m/s by second 10. We can calculate that the change in direction occurs at 9.8 seconds. Answer choice A correctly states that the object’s speed decreases after second 30 as indicated by the downward slope in Figure 1 and the decreasing numbers in Table 1. Answer choice c, which is correct until that point, incorrectly states that the object’s speed continues to increase.
5. From second 15 to second 35 the velocity of object 2 undergoes only very small changes. What is the best explanation for this?
Answer: C
For the period from second 15 to second 35, object 2 has a positive change in velocity of 1 m/s every 5 seconds. An upward force slightly greater than the force of gravity is required to produce this small upward acceleration. Answer choice c, which points to a counterforce capable of producing a 10 m/s 2 upward acceleration against gravity’s –9.8 m/s 2 , is the only one that could be even approximately correct, so it is the best answer. To calculate the answer precisely, first divide the results reported for each 5 seconds by 5 to convert them to 1-secondinterval results. This shows that instead of the 9.8 m/s2 downward acceleration due to gravity, object 2 experienced +0.2 m/s 2
upward acceleration due to the unknown force. Add 0.2 m/s 2 to 9.8 m/s 2 to calculate the correct acceleration level, which is 10 m/s 2 .
Answer choice A is incorrect because object 2 has not leveled off. Its velocity has nearly leveled off, but it is still falling at nearly 100 m/s. Answer choice D is incorrect because the changes in gravitational force due to even the most extreme terrain changes are far too small to produce the result described.
Titration is a method used to measure the concentration level of a given substance in a solution. A solution of known concentration, called the titrant, is slowly added, in measured amounts, to the solution being titrated. The titrant must contain a substance that reacts with the titrated solution, and the reaction must be measurable. Once the two substances have fully reacted, we know the mass of the titrant used
and can calculate the mass of the titrated substance.
The reaction of hydrochloric acid (HCl) and sodium hydroxide (NaOH), a strong base, is represented as HCl + NaOH → H2O + NaCl. This experimental series involves three trials. Each uses a sodium hydroxide solution at 0.2 M concentration as the titrant. The solution to be titrated is precisely 20 ml of hydrochloric acid solution at a concentration between 0.1 M and 0.3 M. (A 1.0 M concentration means 1.0 mole/1.0 liters of water.) The resulting products, water and sodium chloride, are acid neutral. When pH 7.0 (acid neutrality) is reached,
the reaction is complete.
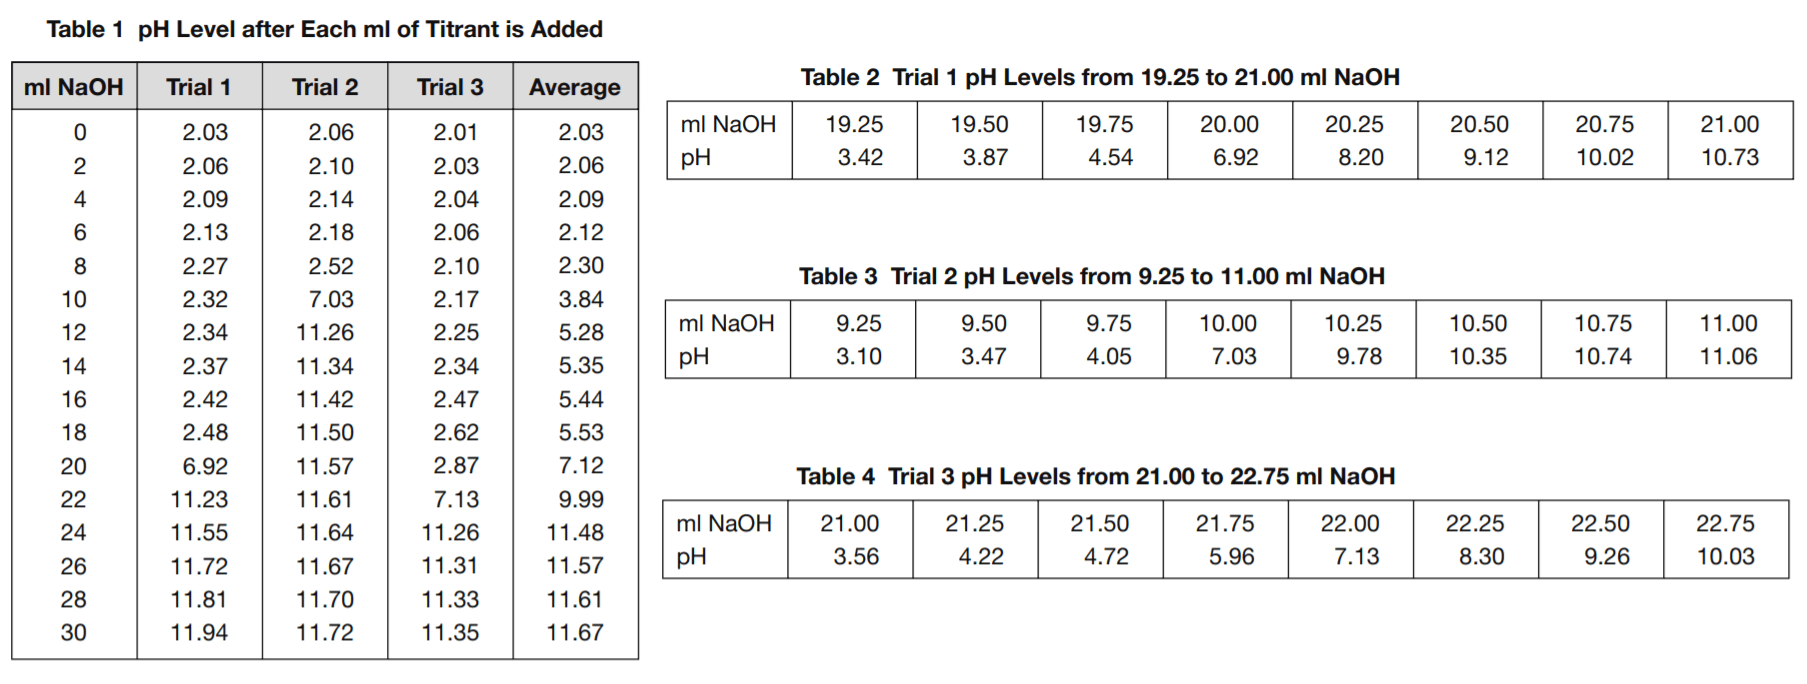
Table 1 shows the pH values after each addition of 2 ml of the titrant, up to 30 ml, for each of the three trials.
Tables 2, 3, and 4 show a detailed view of what happens to the pH levels in the vicinity of pH 7.0 as titrant is added.
6. Based on the formula for the reaction between hydrochloric acid and sodium hydroxide, how many moles of sodium hydroxide are required to fully react with one mole of hydrochloric acid?
View Correct AnswerAnswer: C
The reaction involves one molecule of each substance. Since a mole of any substance has the same number of particles as a mole of any other substance, this reaction requires the same number of moles of each.
7. The molar mass of HCl is 36.5 grams and the molar mass of NaOH is 40.0 grams. How many grams of HCl must be dissolved in a 20 ml solution to bring it to a concentration of 0.1 M?
Answer: B
Multiply 0.1, the desired concentration in moles per liter, by 36.5, the mole mass of HCl, by 0.02 liters of solution.
8. Based on Tables 2, 3, and 4, what is the best estimate that can be made of how many ml of the NaOH titrant it took to neutralize the HCl solutions used in trials 1, 2, and 3?
Answer: D
The tables show only the pH levels for every 0.25 ml of titrant added. pH 7.0 does not occur at any of those precise points. Answer
choice D is based on estimating the actual titrant volume at the point pH 7.0 is reached. Answer choice A is less accurate than choice D because it gives the volume of the titrant only to the closest 0.25 ml shown on the table. Answer choices B and C give the results in the wrong order.
9. How many ml of titrant were used in the trials?
Answer: A
The table shows that at least 30 ml were added in each trial. We do not know if the trial ended at that point.
10. What substances should we expect to discover in the titrated solution at the end of the trials?
Answer: C
NaCl is a product of the reaction. The NaOH titrant continued to be added after the reaction was complete, so NaOH will also be present. Answer choice D is incorrect because this reaction does not produce NH3, and there is no indication of NH3 being present or being introduced into the solution.
11. How should the mass of HCl in the titrated solution be calculated?
Answer: B
Multiplying the concentration of the titrant, given in moles/liter (M), by the number of liters used (c × v) gives us the number of moles of NaOH in the titrant that were used in the reaction. This is also the number of moles of HCl used, because one molecule of HCl reacts with one molecule of NaOH. The mass of HCl is determined by multiplying the number of moles by the mole mass, which is 36.5 grams. The final calculation is 0.2 moles/liter × v liters × 36.5 grams/mole.
A geneticist and a physiologist each explained what causes the wide variety of different height profiles found among different countries and ethnic groups on the planet.
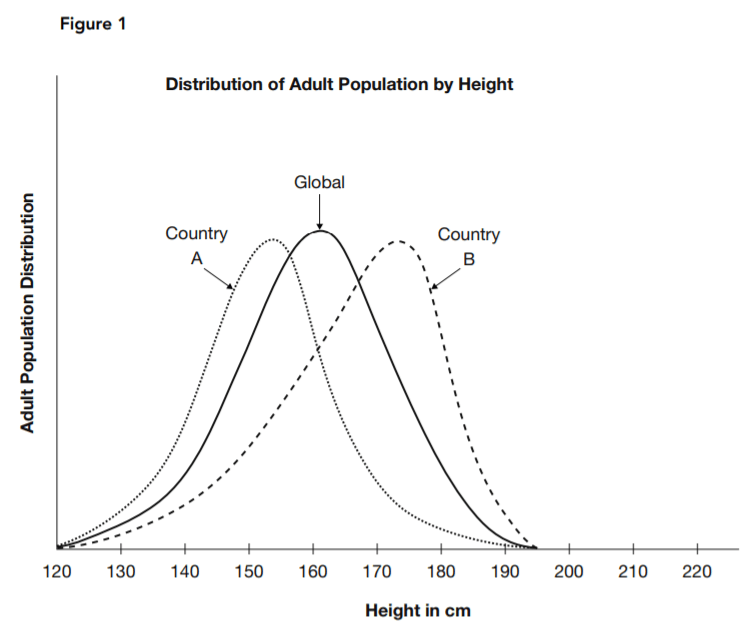
The geneticist pointed to data such as that represented by Figure 1. Each curve shows the reported distribution of the specified adult population over the spectrum of heights. One represents an estimate of global averages, and the other two are estimates for two countries. He argued that the distinctive height profile of each separate population grouping supported the hypothesis that height is determined by
each gene pool.
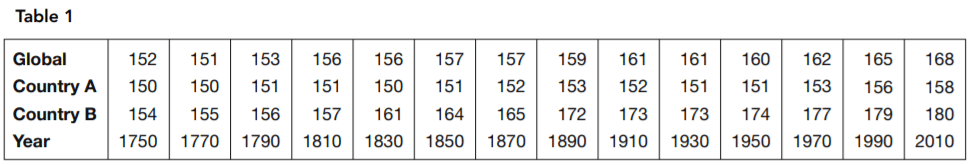
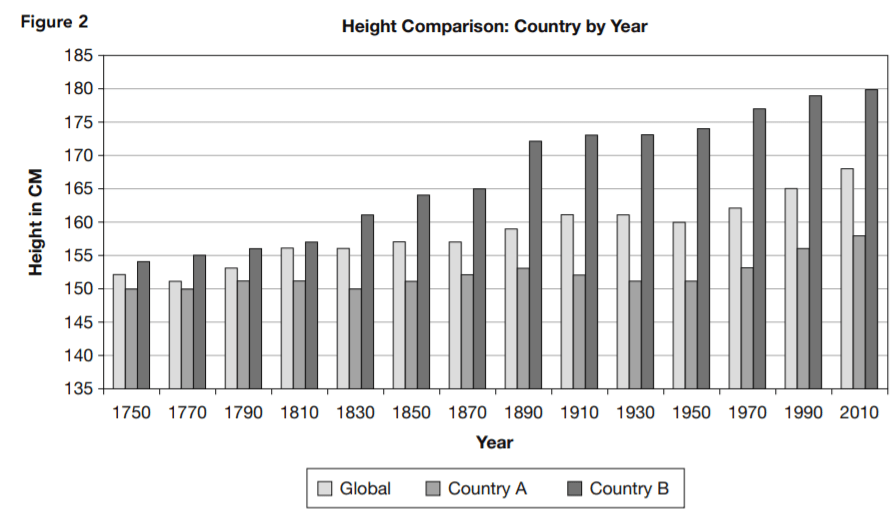
The physiologist said there were significant differences between the global profile and those of the two countries in terms of nutritional and other health-related factors. She also pointed to estimated historical data. Table 1 and the bar chart in Figure 2 present an image of long-term trends in typical height. She argued that if genetics determined the height, no such change would occur.
12. Based on Figure 1, what is a typical height in country A?
Answer: C
The highest concentration, indicated by the highest point of the distribution curve, is at about 153 cm for country A.
13. Based on Figure 1, what is the most typical height in country B?
Answer: A
The highest concentration, indicated by the highest point of the distribution curve, is at about 174 cm for country B.
14. What is the best description of the relationship between the shapes of the three curves shown in Figure 1?
Answer: C
Answer choice C provides the most complete description of the similarities and differences. Answer choice A ignores the clear similarities between the curves, and choice D ignores the differences. Answer choice g misidentifies the difference in shape as a difference in position.
15. Which statement is supported by Table 1 and Figure 2 but not supported by Figure 1?
Answer: B
Table 1 and Figure 2 accurately describe the time comparison shown, which consists of data absent from Figure 1. Answer choice A is incorrect because Figure 1 presents no data on change over time. Answer choice C is not supported by Figure 2. Answer choice D is incorrect because it is also supported by Figure 1.
16. Which is the most complete statement about country B supported by Table 1 and Figure 2?
Answer: A
It reports what the chart indicates. Answer choice B is correct for most of the period shown but not for its entirety. For the period 1970 to 2010, country B’s height increase is less than both the global increase and country A’s increase
17. Which statement about country A is supported by Table 1 and Figure 2?
Answer: D
From 1810 and 1830 and again from 1890 to 1930, country A’s typical adult height was reduced. Answer choice A is incorrect because there was no point shown at which country B’s adult height decreased. Answer choice B is incorrect because country A’s overall progress in height has been interrupted by periods of decline. Answer choice C is incorrect because country A’s adult height actually increased less than one-third as much as country B’s.
18. What hypothesis is supported by a comparison of the three curves in Figure 1?
Answer: C
The right and left extremes of the curve, where the population distribution approaches zero, is nearly identical in each of the curves. Answer choices A, B, and D are not supported by the data given.
NASA is operating the satellite-based Solar Radiation and Climate Experiment (SORCE). Its purpose is to improve our understanding of the nature, including changes in quality and intensity, of solar radiation reaching our planet, by continuously monitoring the intensity of solar radiation by time and by frequency.
Five different instruments are mounted in the satellite to achieve coverage of the desired spectrum range. Table 1 shows the instruments used and the wavelength (λ) range monitored by each. Figure 1 illustrates how they are arranged in the satellite.
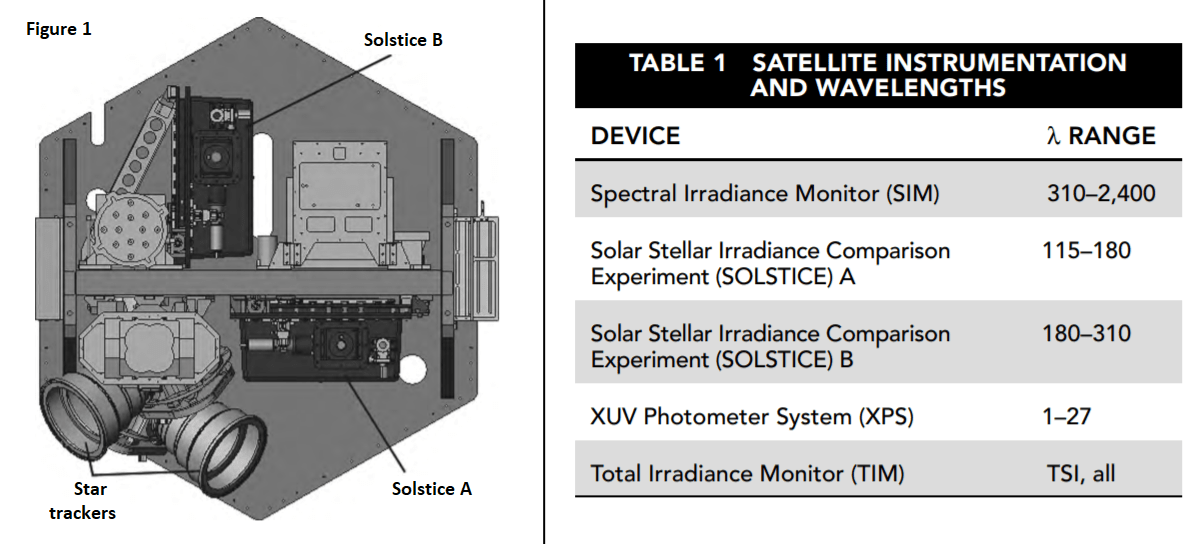
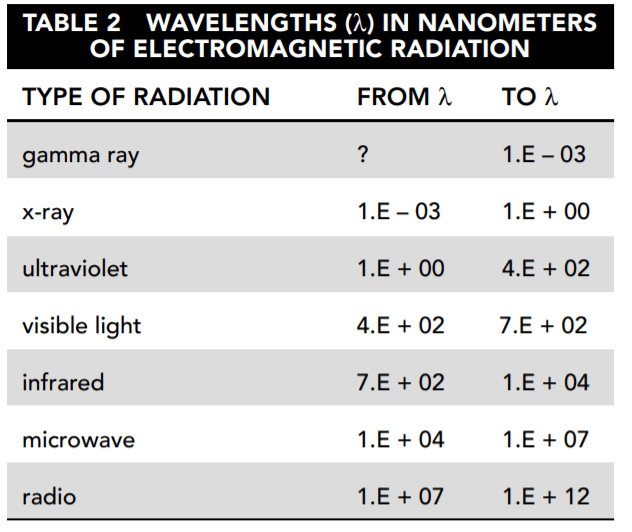
Table 2 names the major categories of electromagnetic radiation and shows the frequency range included in each.
Experiment 1
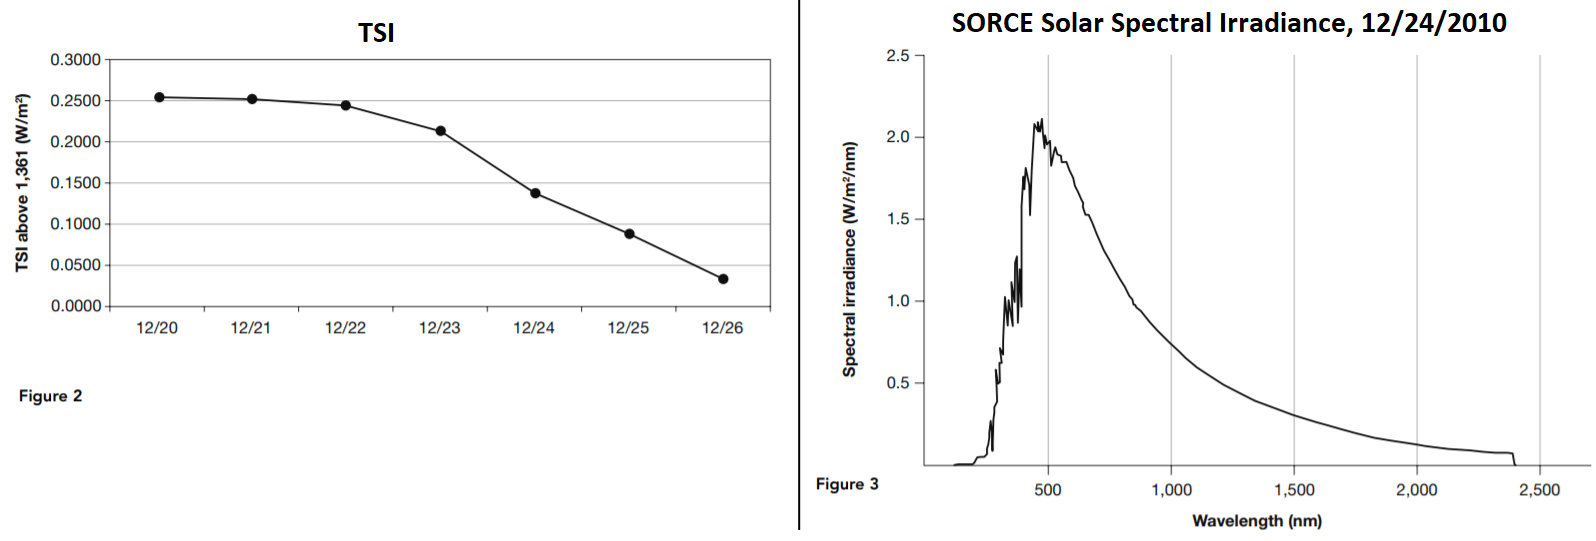
The Total Irradiance Monitor (TIM) monitors the total solar irradiance (TSI) over the entire electromagnetic spectrum. Figure 2 shows the average daily TSI, measured in watts/meter2 (W/m2) as measured by the TIM for December 20 through 26, 2010.
Experiment 2
The other instruments measure irradiance by wavelength. This measure is called solar spectral irradiance (SSI). Figure 3 shows the SSI for December 24, 2010, in watts/meter2/nanometer (W/m2/nm). This is a measure of the intensity of solar irradiance by wavelength.
19. Based on Tables 1 and 2, which types of electromagnetic radiation are measured in the SORCE experiment by instruments other than the TIM?
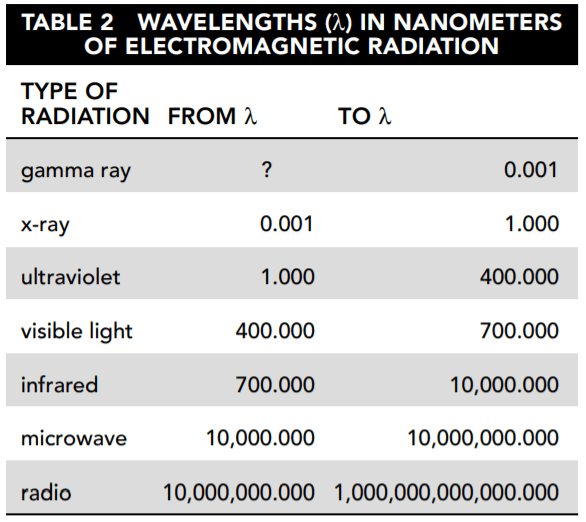
The SIM covers part of the ultraviolet, visible light, and infrared spectrums. SOLSTICE A and B each cover part of the ultraviolet range. XPS begins at 1 nm, which is the upper end of the x-ray range, and extends into the ultraviolet range.
20. According to Table 2 and Figure 3, what is the difference between the lowest and the highest daily average of total solar irradiance (TSI)?
Answer: A
The highest level is 1,361.2513 W/m 2 , and the lowest is 1,361.0329 W/m 2 . The difference is 0.2184 W/m 2 . Answer choice B is in the wrong units, and answer choices C and D are not even approximately correct.
21. Approximately what proportion of the average daily solar irradiance is the difference between the week’s highest level and its lowest level?
Answer: D
The proportion is approximately 2E – 1 divided by 1.6E + 3. That would have to be approximately ( 2 /1.6) × 10 -4 . Answer choice D is the only answer that approximates that.
22. Based on Figure 3, which wavelength transmitted the highest level of solar irradiance?
Answer: C
The wavelength in nanometers (nm) is shown on the x-axis, and the level of solar irradiance is shown on the y-axis. The highest point is approximately 2.1 W/m 2 /nm (watts/meter 2 /nanometers). This occurs at a wavelength of somewhat less than 500 nm.
23. What best describes the difference between total solar irradiance (TSI) and solar spectral irradiance (SSI)?
Answer: B
TSI is measured in watts/meter 2 , which is a measure of power. SSI is a measure of the same power separated into different wavelength ranges. The definition of SSI given in answer choice A has no definite meaning. Answer choices C and D refer to solar energy, but TSI and SSI are magnitudes of power, not energy.
24. Based on Figure 3 and Table 1, which type of electromagnetic radiation carries the most solar irradiance?
Answer: B
The largest area under the SSI curve occurs between approximately 400 and 700 nm, which is the visible light range.
25. Refer again to Figure 3. After visible light, which type of electromagnetic radiation carries the most solar irradiance?
Answer: C
According to Figure 3, almost all of the irradiance is delivered in the visible light, infrared, and ultraviolet spectra. The magnitude of irradiance delivered by the other types does not even appear clearly on the graph. The ultraviolet irradiance is defined by the small sliver of area under the curve between 0 and 400 nm. The infrared area from 700 to 2,500 nm is significantly larger.
Microbe populations, including those of disease-producing bacteria, can change their characteristics over relatively short periods of time. A series of experiments involving pneumococci were conducted to determine whether and how these changes take place. In all three of the experiments described here, measures were taken to protect against contamination from other bacteria throughout the course of the
experiments.
Experiment 1
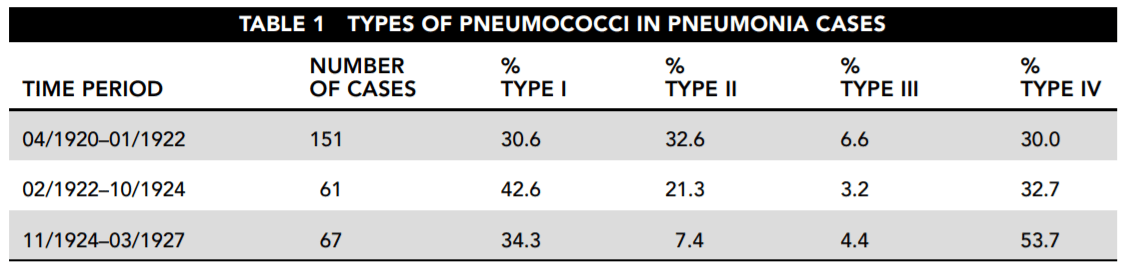
A five-year study was conducted of the prevalence of each type of pneumococcus found in pneumonia victims. Table 1 shows the results. For the purpose of simplification, the pneumococcal types I through VI referred to here do not necessarily correspond either to those used in the original study or to those in current usage.
Experiment 2
A subsequent study was conducted to determine what happens to strains of pneumococci in a disease victim. It examined changes both to the pneumococci infecting the victim and to those extracted from the victim.
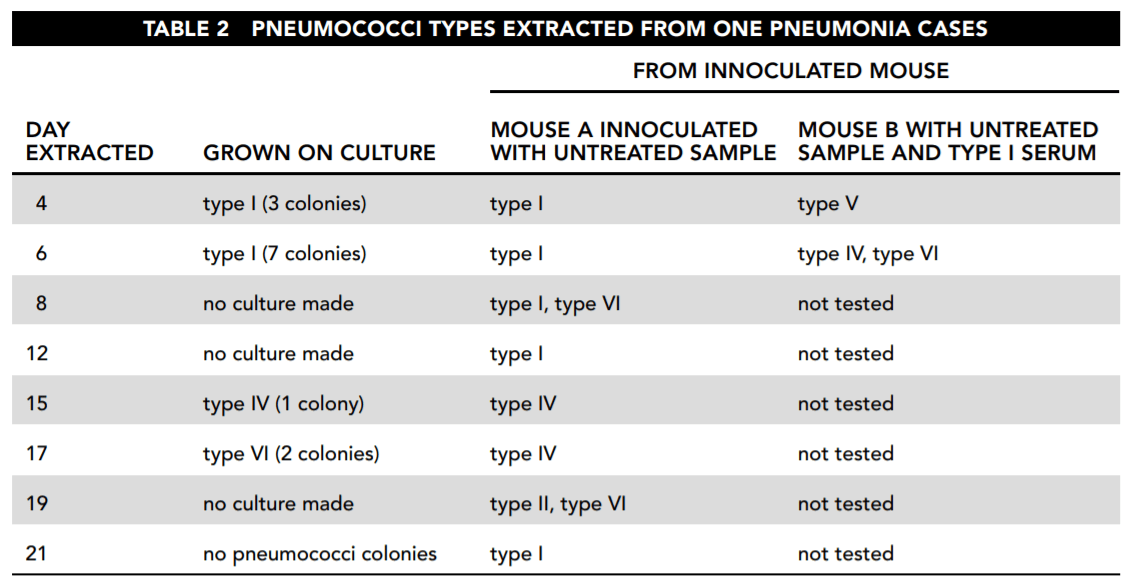
First, samples were taken from a patient who was initially analyzed to be infected only with type I pneumococci. Cultures were grown from these samples in three ways and analyzed. The first was simply to grow bacterial colonies from the sample in petri dishes. The second was to examine what happened when the same bacteria infected others. Mouse A was inoculated with untreated infected material. Then mouse B was inoculated with type I serum, which kills type I bacteria, and with the infected material from the patient. Table 2 reports those results. (Note: each day a different mouse B and mouse A were used.)
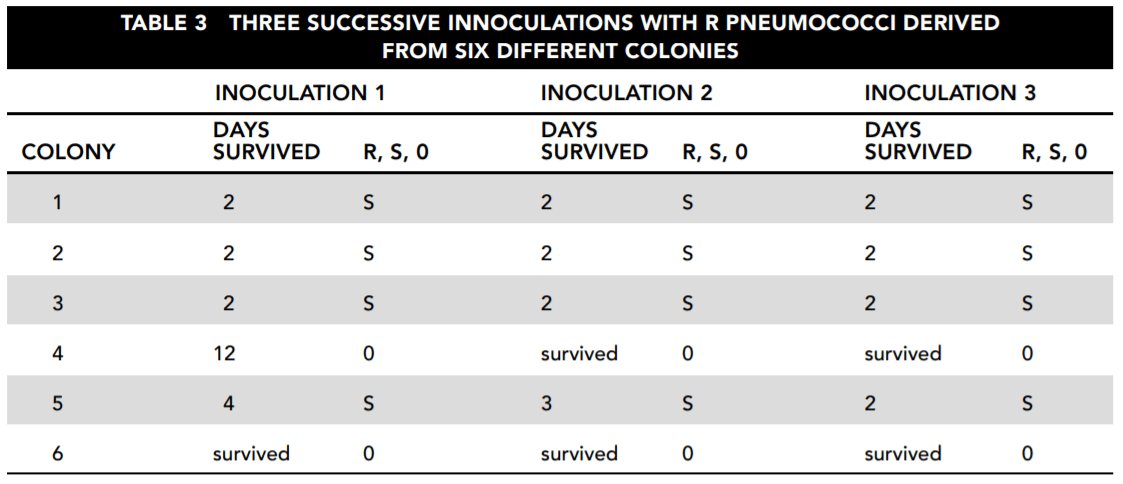
Experiment 3
The next experiment examined the changes that occurred when bacteria from six different pneumococcal colonies were used to inoculate mice. These colonies were cultured in laboratory conditions to eliminate uncertainties of the previous experiments. All of these colonies were of rough (R) bacteria. Bacteria can be divided into smooth or encapsulated (S) and rough or unencapsulated (R). The smooth, encapsulated bacteria are the most dangerous because they are coated with material that protects them from antigens. The rough, unencapsulated bacteria are usually harmless.
In each case, a mouse was inoculated with R bacteria from the colony. The mice either died after between 2 and 12 days or survived indefinitely. The blood of each deceased mouse was then cultured and tested for pneumococci that were examined to determine whether they were R or S bacteria. Table 3 reports the results.
26. Consider the results reported in Table 2. Which of the following statements about the samples taken directly from the patient and culture is correct and important for the study?
Answer: B
Answer choice B presents evidence of exactly what is being looked for: a change in the nature of the bacterial population. Answer choice A is not correct because we do not know why no culture was made on day 19. Answer choices C and D are conjectures for which there is no strong evidence presented in the table.
27. Based on the overall findings reported by Table 2, which of the following answers is most correct?
Answer: D
Answer choice D indicates a fact relevant to the purpose of the study. The cultures taken directly from the patient showed first type I, then type IV without type I, and then type VI without either type I or type IV. Type I dominated the results of the inoculated mouse A, but it did not appear in the day 15 or 17 samples. It then reappeared on day 19, along with type VI, but reappeared alone on day 21 even though the culture from the patient grew no colonies. Answer choice A is not correct. On days 4 and 6, mouse B was infected with types V and VI pneumococci, without any evidence that these were in the sample from the patient. On day 8 mouse A was infected with type VI, which did not appear in the patient until day 17. Answer choice B is not correct because that day’s sample infected mouse A with both type I and type VI, and we are not even sure this patient, let alone most patients, was cured at the point of type VI’s appearance. Answer choice C draws a conclusion based on how the bacterial types were numbered, rather than on the observed operation of the bacteria.
28. From the standpoint of understanding how bacterial strains change over time, what is the most interesting thing about the results reported in Table 3?
Answer: D
The consistency of this result is a strong indicator that the colonies do change their characteristics in a systematic way. Answer choices A and C indicate only that some strains are more virulent than others, but that is to be expected. Answer choice B incorrectly claims that all of the samples changed, but the surviving mice were not tested.
29. Which answer is the most important statement supported by the data reported from the three experiments?
Answer: B
The consistency of this result is a strong indicator that the colonies do change their characteristics in a systematic way. Answer choices A and C indicate only that some strains are more virulent than others, but that is to be expected. Answer choice B incorrectly claims that all of the samples changed, but the surviving mice were not tested.
30. Which statement is best supported by the data in Table 2, viewed in conjunction with the other data?
Answer: B
It is important to be able to look at the data presented and draw conclusions from what seems to make sense based on other inputs. The idea that one stable form of bacteria is at work from the beginning to the end of this course of illness is refuted. Answer choice B is refuted by the data. Answer choice C is not supported. The original type I strain seems to have been weakened or transformed to others, but there is no evidence that it destroyed itself. There is also nothing to support answer choice D.
Variations in the proportion of the two major isotopes of oxygen, 18 O and 16 O, in seawater or landbased water, including glacial ice, are believed to be a proxy for changes in temperature. 16 O is lighter than 18 O, so it evaporates first from seawater. This leaves a higher concentration of 18 O in seawater and a lower concentration in the evaporated water, which then falls to Earth as precipitation. If the falling water freezes, glaciers are formed, which trap the low 18 O precipitated water. In glacial periods, oceans are richer in 18 O, but in interglacial periods the glaciers melt and 16 O-rich water flows back into the oceans. For this reason high 18 O concentrations in seawater are believed to be an indication of cold climate periods in which glaciers are built up.
The measure of how far above normal the concentration of 18 O in a sample it is called δ 18 O. It is computed as follows:
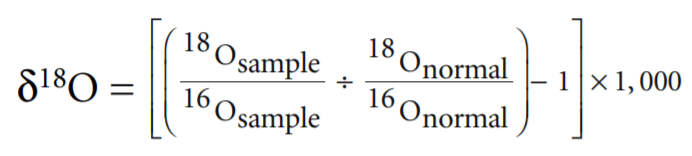
Thus high δ 18 O means more 18 O and less 16 O than normal. Low δ 18 O is the reverse. Figure 1 illustrates the δ 18 O cycle from seawater
to the atmosphere to glaciers on land and back to seawater.
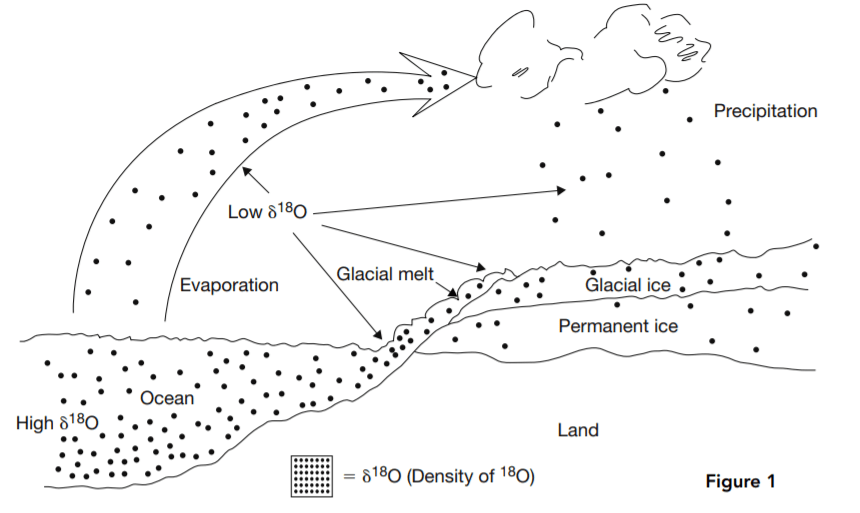
Low δ 18 O water evaporates from the ocean, leaving higher δ 18 O water behind. The evaporated water falls as precipitation, forming low δ 18 O glaciers. In interglacial periods, the glaciers melt, and 16 O flows back into the ocean, reducing δ 18 O there.
Figure 2 is a simplified representation of the changes in seawater δ 18 O for the past 2,000,000 years. The high δ 18 O periods are when 16O evaporates from the seawater and is frozen into glaciers. The low δ 18 O periods are when the glaciers melt and return the 16 O to the seawater.
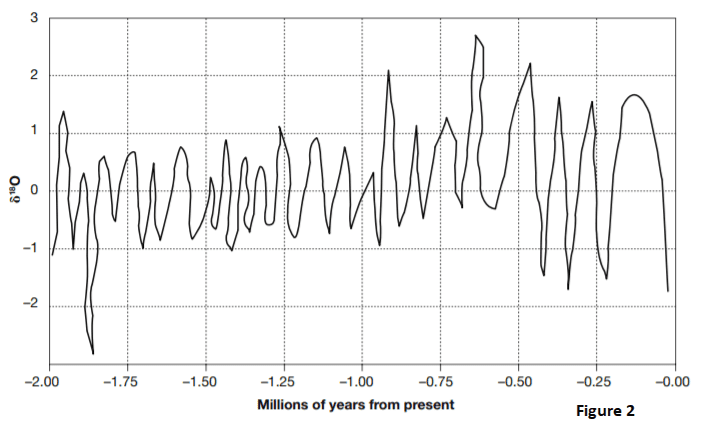
31. Based on Figure 2 and the relationship between δ 18 O, glaciation, and climate, how long ago was the period with the coldest temperatures and the most glaciation?
Answer: C
Always make sure you understand what each direction on the chart, table, or graph means. In this case, high δ 18 O means cold climate and glaciation. The highest δ 18 O level shown is about 2.5, which occurred at about –0.65 million years.
32. Based on Figure 2 and the relationship between δ 18 O and the return of melted glaciers to the ocean, how long ago would sea levels have been highest?
Answer: D
High sea levels occur when glaciers melt, filling the oceans with low δ 18 O water. The lowest δ 18 O level shown is about 2.8, which occurred at about –1.85 million years. Answer choice C is incorrect. The peak at 1.93 million years ago would indicate low seas, rich in δ 18 O.
33. Referring to Figure 2, how many periods of glacial buildup occurred between 0.25 and 0.50 million years ago?
View Correct AnswerAnswer: A
Periods of glacial buildup are marked by peaks in δ 18 O. There were three between –0.25 and –0.50 million years
34. Based on Figure 2, what is the highest number of glacial melting periods to occur within one 0.25-million-year span?
View Correct AnswerAnswer: D
Glacial melts dilute the high δ 18 O seawater with 16O-rich glacial water, and are marked by low δ 18 O seawater. Between –1.25 and –1.50 million years there are four δ 18 O troughs.
35. During what period shown on Figure 2 were the temperature swings between glacial buildups and glacial melts consistently the most mild over an extended period of time?
Answer: B
Temperature swing is indicated by the difference between the highest and lowest δ 18 O levels. From –0.90 to –1.75 million years, δ 18 O rose to 1 and no higher and then dropped to –1 and no lower, almost like clockwork. That is a range of only 2 between high and low. For the rest of the span of time shown, the δ 18 O high levels were generally above 1 and as high as 2.7. The lows were as low as –2.7.
Valency is a concept in chemistry that provides rules for determining which chemical elements can combine in what proportions to form compound substances. Protons and neutrons together form the nucleus at the center of an atom. The much lighter electrons whirl around the nucleus in what are called shells, rings, orbits, or energy levels. The left-hand diagram in Figure 1 is a representation of this structure.
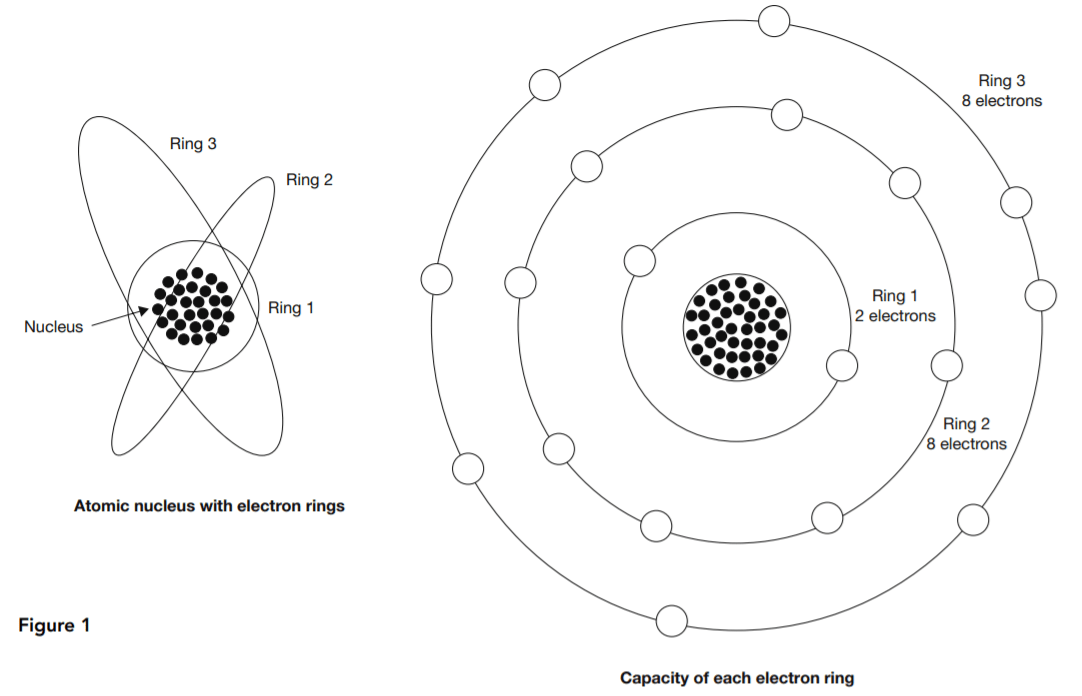
At right in Figure 1 is a representation of valency. Each electron ring has a normal electron capacity. The first ring’s capacity is two electrons. The other rings each have a capacity of eight electrons. Atoms tend to bring their outer rings to capacity through some kind of collaboration or exchange with other atoms. The valency of an atom is the number of surplus or deficit electrons in its outer ring.
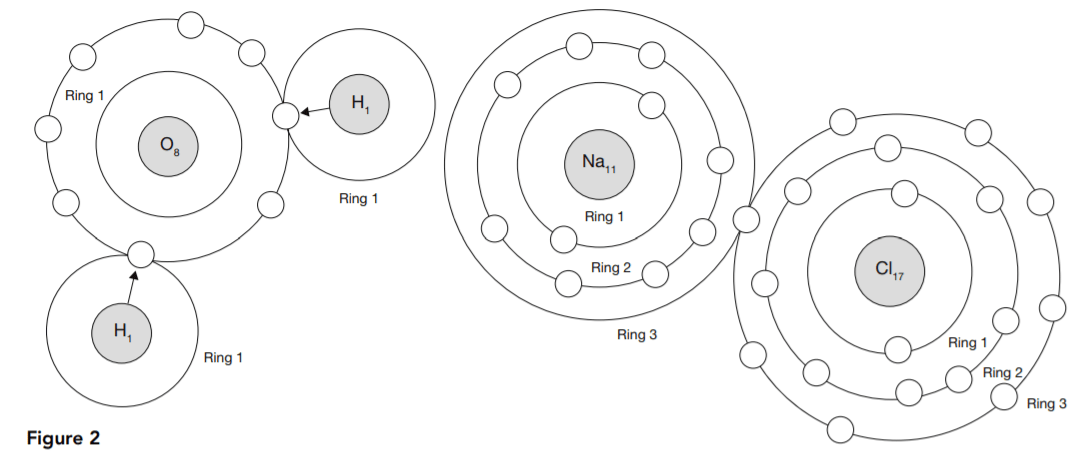
Ionic bonding involves a combination of atoms having only one or two electrons in their outer rings with others that need only one or two electrons to complete their outer rings. The first type empty their incomplete outer rings by lending out their outer-ring electrons, and the second type borrow them to complete their outer rings. This is called ionic bonding because the atoms become electrically charged ions. The attraction between the positive ions that give up their electrons and the negative ions that receive them helps to bind the resulting compound.
Figure 2 shows how this works in the case of two common substances, H2O and NaCl, water and salt.
Tables 1 and 2 show how each atom borrows or loans electrons either to complete or to empty its outer ring.
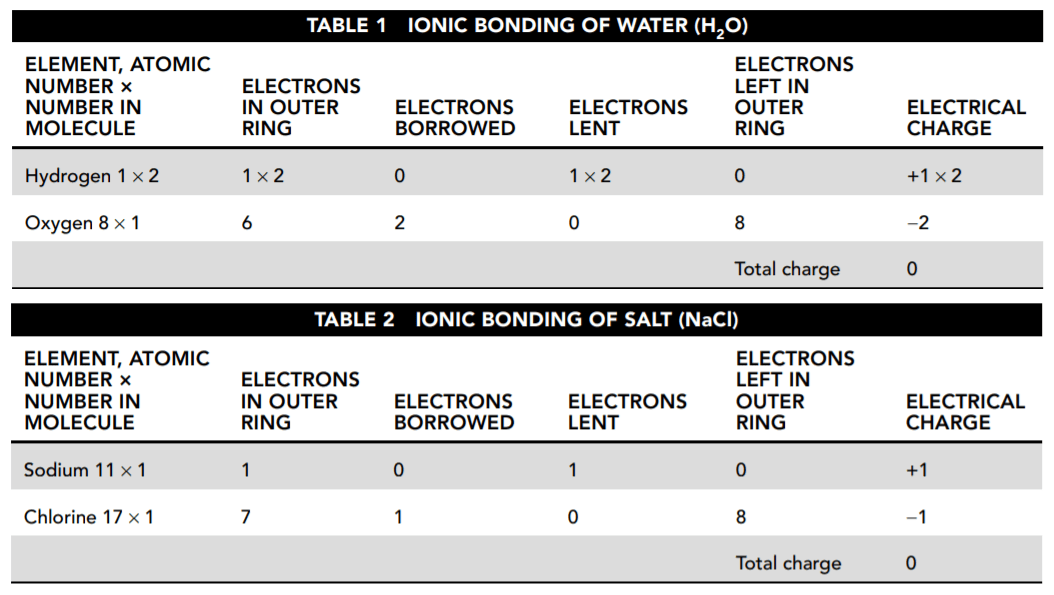
36. According to Tables 1 and 2, what is the resulting charge of each compound?
Answer: D
The tables show that the total charge for each substance is zero. Due to their electrical charge, ions tend to move away from like-charged ions and toward oppositely charged ions to form electrically neutral compounds.
37. Refer to Tables 1 and 2 and Figure 1. When sodium (Na) is stripped of the one electron in its outer shell, what is its electrical charge?
View Correct Answer Answer: A38. Based on Figure 2 and the explanations presented here, how many electron rings does a positive sodium ion have?
View Correct AnswerAnswer: B
Sodium has an atomic number 11, and, therefore, neutral sodium has 11 electrons. The first ring has two and the second has eight. That leaves one electron to form the third ring. That electron is given up when sodium is ionized, leaving the first two rings.
39. Based on the data presented here about ionic bonding, which element other than sodium would chlorine (Cl) be most likely to form an ionic bond with?
Answer: D
Chlorine needs just one electron to complete its outer ring of eight, and hydrogen is able to donate it. Ionic bonds are formed between atoms needing electrons to fill a nearly complete outer ring (positive valence) and those needing to get rid of atoms in a nearly empty outer ring (negative valence). It might seem that an atom like chlorine could just as easily get rid of all seven of its outer ring electrons as acquire one, but that kind of reaction is very rare.
40. As shown in Figure 2 and Table 1, hydrogen and sodium each have only one electron in their outer rings. In light of the information presented here, what is the best explanation for why it takes one sodium atom to form a compound with one chlorine atom, but it takes two hydrogen atoms to form a compound with one oxygen atom?
Answer: C
The key in ionic bonding is not the number of atoms combined, but the number of electrons required or available to produce complete outer electron rings. Chlorine needs only one and sodium has one extra to provide. Oxygen needs two, but hydrogen only has one per atom to provide. That is why water has two hydrogen atoms to donate electrons and salt has only one sodium atom